


Background
A water treatment plant in Kenya experiences a rapid drop in flow rate of over 50%
The treatment plant received its water via gravity feed from an intake 15km away, across hilly terrain. The plant serviced a population of 300,000 residents, who were growing increasingly frustrated because they were not receiving water. The system was designed to deliver 11,000 m3/day, but about 3 years after the system was handed over, the flow rate rapidly declined to an average of just 7,000 m3/day.
Challenge
Initially the site engineers suspected that this drop-in flow rate was due to siltation issues and hoped the flow would return to normal after the silt cleared up. But it didn’t. In fact, the flowrate dropped to an untenable 5274 m3/day, leading the site engineers to suspect that air lock in the pipelines was the root cause of the problem. With pressure mounting from customers, staff, and management, the site engineers uploaded their data into ARIavCAD and started analysis and troubleshooting with the Aquestia-Dorot Engineering Team.
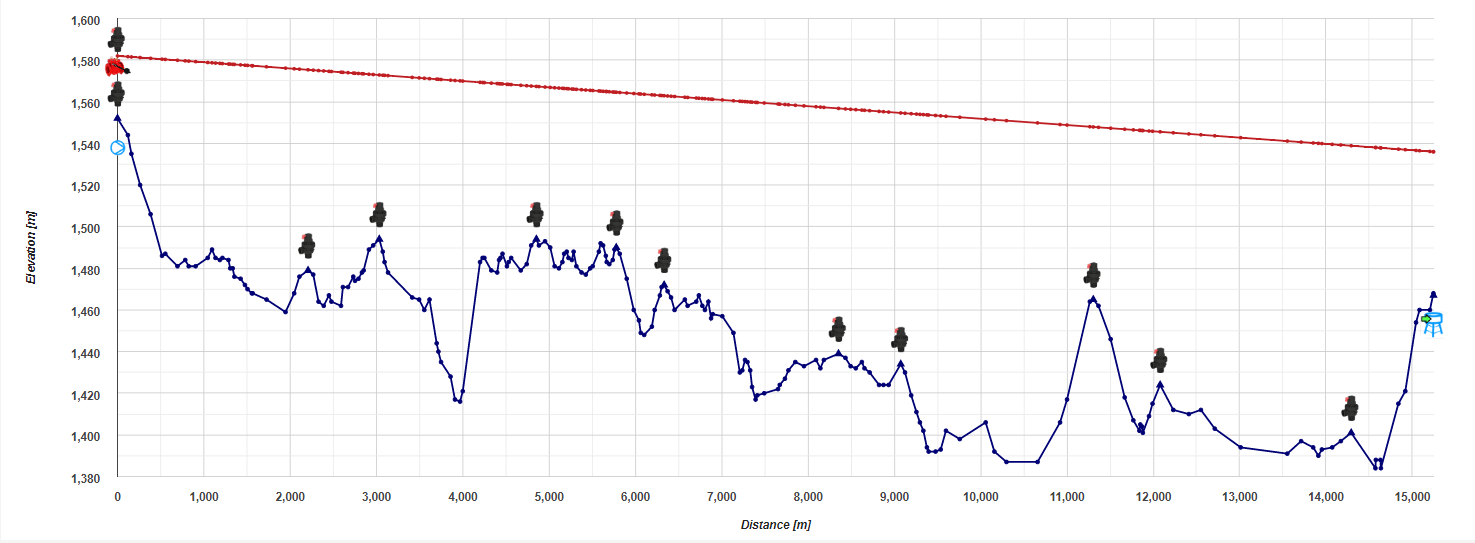
Figure 1: Profile View of the system, produced using ARIavCAD
Solution
Analysis of the system in ARIavCAD and strategic replacement of air valves
The original air valves were in a poor condition and were prone to leaks, so the Aquestia-Dorot engineering team recommended replacing all 36 air valves in the system. However, due to budget constraints, the site could only replace 12 valves. So, which of the 12 air valves should be replaced? This question was answered by the ARIavCAD Profile View of the system (Figure 1). Here, the engineers could identify the 12 most critical positions for the replacement air valves. ARIavCAD also specified the optimal, most cost-effective air valve models and sizes for the system.
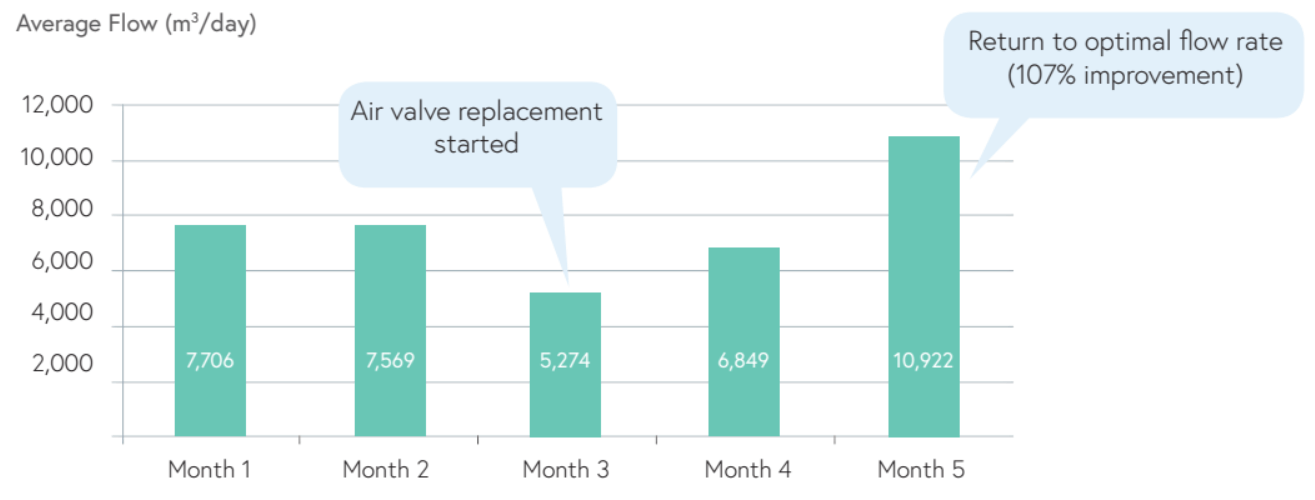
Figure 2: Average flow rate decrease, and then return to the flow rate for which it had been designed.
Results
A return to optimal flow rate – meaning significant cost savings and increased revenue for the utility
12 of the valves were replaced, and within two months, the flow rate had increased by an incredible 107% (see the improvement from Month 3 to Month 5 in Figure 2). In this short space of time, the system was back to delivering the flow rate it was designed for. This was after only a third of the valves had been replaced.
By using ARIavCAD, the design engineers were able to implement a solution that fit within the utility’s budget and returned the system to the flow rate it was designed for within just two months. If you consider more drastic solutions, such as replacing the pipeline, then the air valve solution potentially saved the utility millions of dollars – and the results were realized almost immediately.
The web-based ARIavCAD software allowed for seamless collaboration between the members of the engineering team in Kenya and with the A.R.I.-Dorot engineering team. This resulted in faster decision-making and buy-in from all stakeholders – a huge saving in time and effort. That’s not to mention the increased levels of motivation from the team after being involved in this successful project.
Perhaps most importantly, the increased flow rate meant that customers were receiving the water they required. So, not only did the complaints end, but the increased usage meant increased revenue for the utility – a true win-win for all.